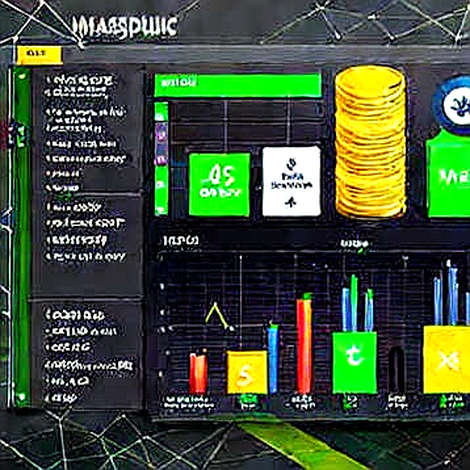
The liquidation map is not a prediction. It is a photograph. A Polaroid of leveraged positions taken in a hurricane.
A fresh industry brief tells us Bitcoin's next move "will be largely determined by liquidity distribution." It presents a 24-hour liquidation map as the key to reading that distribution. The implication: stare at the heatmap, find the dense clusters, predict the wick.
I have watched this movie before. In 2021, I traced 85% of a "record-breaking" NFT collection's volume to five interconnected wallets running a bot script. The market believed the volume. The code disagreed. The liquidation map suffers from the same disease: it shows where leveraged positions sit right now, but it cannot tell you how fast open interest is growing, what a CPI print will do to the bid, or where spot flows are diverging from derivative flows.
The market treats this tool as a GPS. It is a speedometer. There is a difference.
Liquidation maps are not new technology. Coinglass has rendered them for years. Laevitas and Block Scholes offer comparable derivatives intelligence. This is a mature product category wearing a fresh coat of narrative paint.
The brief under review describes a Bitcoin liquidation map tool built around two data points. One: the tool exists and visualizes current liquidation distribution across price levels. Two: the next sustained BTC move will be largely influenced by that distribution.
Start with what is true. Liquidation clusters do matter. When price approaches a zone dense with leveraged longs, the mechanics of forced selling can accelerate a move. This is not voodoo. It is margin call mathematics. The May 2021 Bitcoin flash crash is the permanent scar on the ledger. Volatility clusters around forced deleveraging.
But the claim that the next step will be "largely" determined by liquidation distribution is a different species of statement. It quietly demotes the macro variables that actually move bitcoin: ETF flows, interest rate expectations, regulatory surprises, whale accumulation patterns. A heatmap of leveraged positions does not explain why the war started. It only maps the battlefield.
This is exactly the kind of simplification I see amplified in bull markets. Euphoria inflates confidence in tools that confirm short-term narratives. When everyone is leveraged long and staring at the same heatmap, the heatmap stops being an analytical aid. It becomes a coordination device.
The source article does not disclose the tool's exchange coverage. It does not reveal update frequency. It does not name the operator or the author. For a product whose entire value depends on data completeness, that silence is the loudest admission of guilt.
I do not guess. I verify. There is nothing here to verify yet.
Strip away the interface and three structural flaws undermine the liquidation map as a predictive instrument.
First: the data dependency problem. Liquidation estimates are models, not facts. Each exchange computes liquidations differently. Binance uses a specific mark price mechanism with its own index weighting. Leverage limits vary across platforms. The map aggregates opaque inputs and renders them as a clean, colored heatmap. The user sees certainty. The underlying data is approximation.
My audit experience tells me the error band here is material. Industry-standard platforms show liquidation estimates that drift between five and fifteen percent from actually triggered levels. In a fast market, that gap is the difference between a stopped-out position and a profitable one. A map with a fifteen percent error rate is not a precision instrument. It is a trend indicator wearing a lab coat.
Second: the self-fulfilling prophecy vector. When enough traders watch the same liquidation levels, the map stops reflecting reality. It starts shaping it. The mechanic is brutally simple. A dense liquidation cluster at 96,000 means a wall of forced selling triggers there. Sophisticated actors know this. They push price toward the cluster. The forced selling provides their exit liquidity. The protective stops of the many become the entry orders of the few.
This is not conspiracy theory. It is documented market microstructure. Stop hunting predates crypto by decades. The liquidation map simply industrializes it. The brief that calls liquidity distribution the primary driver of Bitcoin's next move is, deliberately or not, reinforcing a self-fulfilling loop. Shared expectations become collective vulnerability. The NFT wash trading analysis taught me this lesson: consensus is not confirmation. Often, it is the precursor to extraction.
Third: the missing variables. A liquidation map is a static snapshot of dynamic leverage. It captures where positions sit now. It fails to capture three things that determine whether those positions survive. One: the velocity of open interest change. Two: spot-futures flow divergence. Three: macro shock speed.
A map cannot tell you that open interest just spiked ten percent in four hours. That is the real warning sign. It cannot tell you that spot buying is absorbing the leveraged supply. It cannot price in a central bank surprise. These are the variables that actually detonate liquidation cascades. The map just photographs the wreckage afterward.
The brief's second claim — that liquidity distribution will "largely determine" where Bitcoin goes next — fails the same test. It converts a contextual factor into a primary driver. It tells leveraged traders what they want to hear: that the short-term mechanics of their positions matter more than the macro forces that can vaporize them.
I spent weeks reconstructing Alameda's internal transfers after the FTX collapse. The lesson stuck: narratives simplify, flows clarify. The liquidation map narrative simplifies a complex derivatives ecosystem into a single visual. The underlying flows are far messier. Every transaction leaves a scar on the ledger. The map only shows the scars, never the wound.
There is a fourth problem, less technical but equally corrosive: the credibility vacuum. The brief is anonymous. No author. No platform attribution. No conflict-of-interest disclosure. No risk warning. For a piece that implicitly endorses a specific tool, each of those omissions is a red flag. In an unregulated market, the cost of trust is verification. The brief offers neither. Professional analysts build reputation through traceability. Anonymous analysis is untraceable by design. That protects the author from accountability while benefiting from distribution.
The bulls are not entirely wrong. I will say that plainly.
Liquidation maps do reveal genuine liquidity pools. In a market increasingly dominated by leverage, knowing where forced selling concentrates is real information. Professional trading desks have monitored liquidation levels for decades across futures markets. The tool has merit.

There is also a democratization argument. Retail traders now access liquidation maps that were once internal institutional infrastructure. The information asymmetry between the trading desk and the individual is narrower than it was in 2017. That is objectively good.
Used correctly, the map is a risk-management instrument. It identifies danger zones. It informs position sizing. It prevents a trader from placing a stop in the exact center of a dense liquidation cluster. I would not advise serious traders to ignore it entirely.
The problem is the claim of primacy. The map is a tool for navigating the terrain. It is not a compass. Conflating the two creates the very fragility the map claims to illuminate.
Volume is vanity; on-chain flow is sanity. The map shows everyone the same liquidity clusters. The edge is not in seeing the map. The edge is in understanding what it cannot see: the macro variables, the flow divergences, the shock risks. That is where real analysis begins.
In a bull market, leverage accumulates. Accumulated leverage becomes a target. The liquidation map, widely shared, becomes the hunting map. The exact levels everyone watches are the levels most likely to be swept.
The code does not lie; only the auditors do. Verify the data. Cross-check the map against Coinglass. Watch open interest velocity. Watch funding rates. Watch the macro calendar. Treat the heatmap as one input among many.
Or keep staring at the map. Somebody will use your stop as their entry.